
Occasionally we at Carlstrom Consulting see trends or other tidbits that are important to comment on. With the COVID-19 pandemic going on as well as the start of the school occurring here in Oregon looking at the trends are import in making important decisions. Oregon has generally had a milder incidence of COVID-19 than other states, but unfortunately not everyone in Oregon has been as diligent at prevention. In looking at the 14 day moving average of cases and deaths by reported date in Oregon we can see the following:
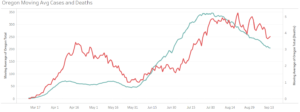
The light green being new cases with the red being deaths reported. Due to the differences in scale it looks like deaths spiked at a higher rate in the beginning, but the peak around April 16th was an average of 3 deaths a day the previous 14 days. As new cases stabilized after this peak you can see the average deaths come back down. For the purposes of this post we will pass discussing this at this time.
I want to bring your attention to the second peak that occurred on July 24 which was a 14 day average of 343.1. The next subsequent peak of deaths occurred on July 31 with a 14 day average of 4.857. One week after the new cases peak. We can see that while the number of new deaths report has stayed in the 4-5 deaths that 14 day period that the new cases has been on a downward trend since August 7th. The current new cases average is 203.9 new cases per day for the 14 day average and 3.786 deaths per day for the 14 day average. If the new cases comes to a stabilized point as before then we should eventually see the average deaths to begin to decline. If new cases reverse course and go back up then we would expect the number of deaths to potentially increase yet again.
On a personal note the Oregon Health Authority and Oregon Department of Education set a few metrics as a standard for in person instruction in K-12 schools. They focus on the number of new cases per 100K and the positive test rates, but there are a few exceptions for more rural counties and districts. Guidelines can be found here. Focusing on the main metrics these are at the state level the positive test rate must be under 5% for the preceding 7 days for 3 weeks. At the county level the rate of new cases per 100,000 people in the preceding 7 days must be under 10 and the positive test rate the preceding 7 days must be under 5% for three straight weeks. For example, for Lane County we can see the following trends:
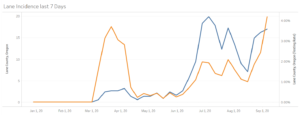
We can see that there is an upward trend in new cases since August 24th. Based on the recently released testing data we can see that the new cases per 100k have been increasing since August 16th with incidences as follows:
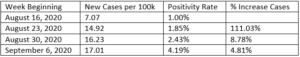
What we can ascertain from this is that the number of confirmed cases is increasing while there are fewer cases being caught. While the rate of new cases seems to be increasing at lower rates, the fact that the positivity rate is increasing means we are getting a less accurate picture of the real number of cases.
Summary of information from the Lane County Public Health Department can be found here. The Lane County team appears to track confirmed and presumptive cases in their metrics. There are two concerning trends that will likely impact school districts in Lane County.
To access data for the state of Oregon as well as counties you can find here or use the following to examine:
